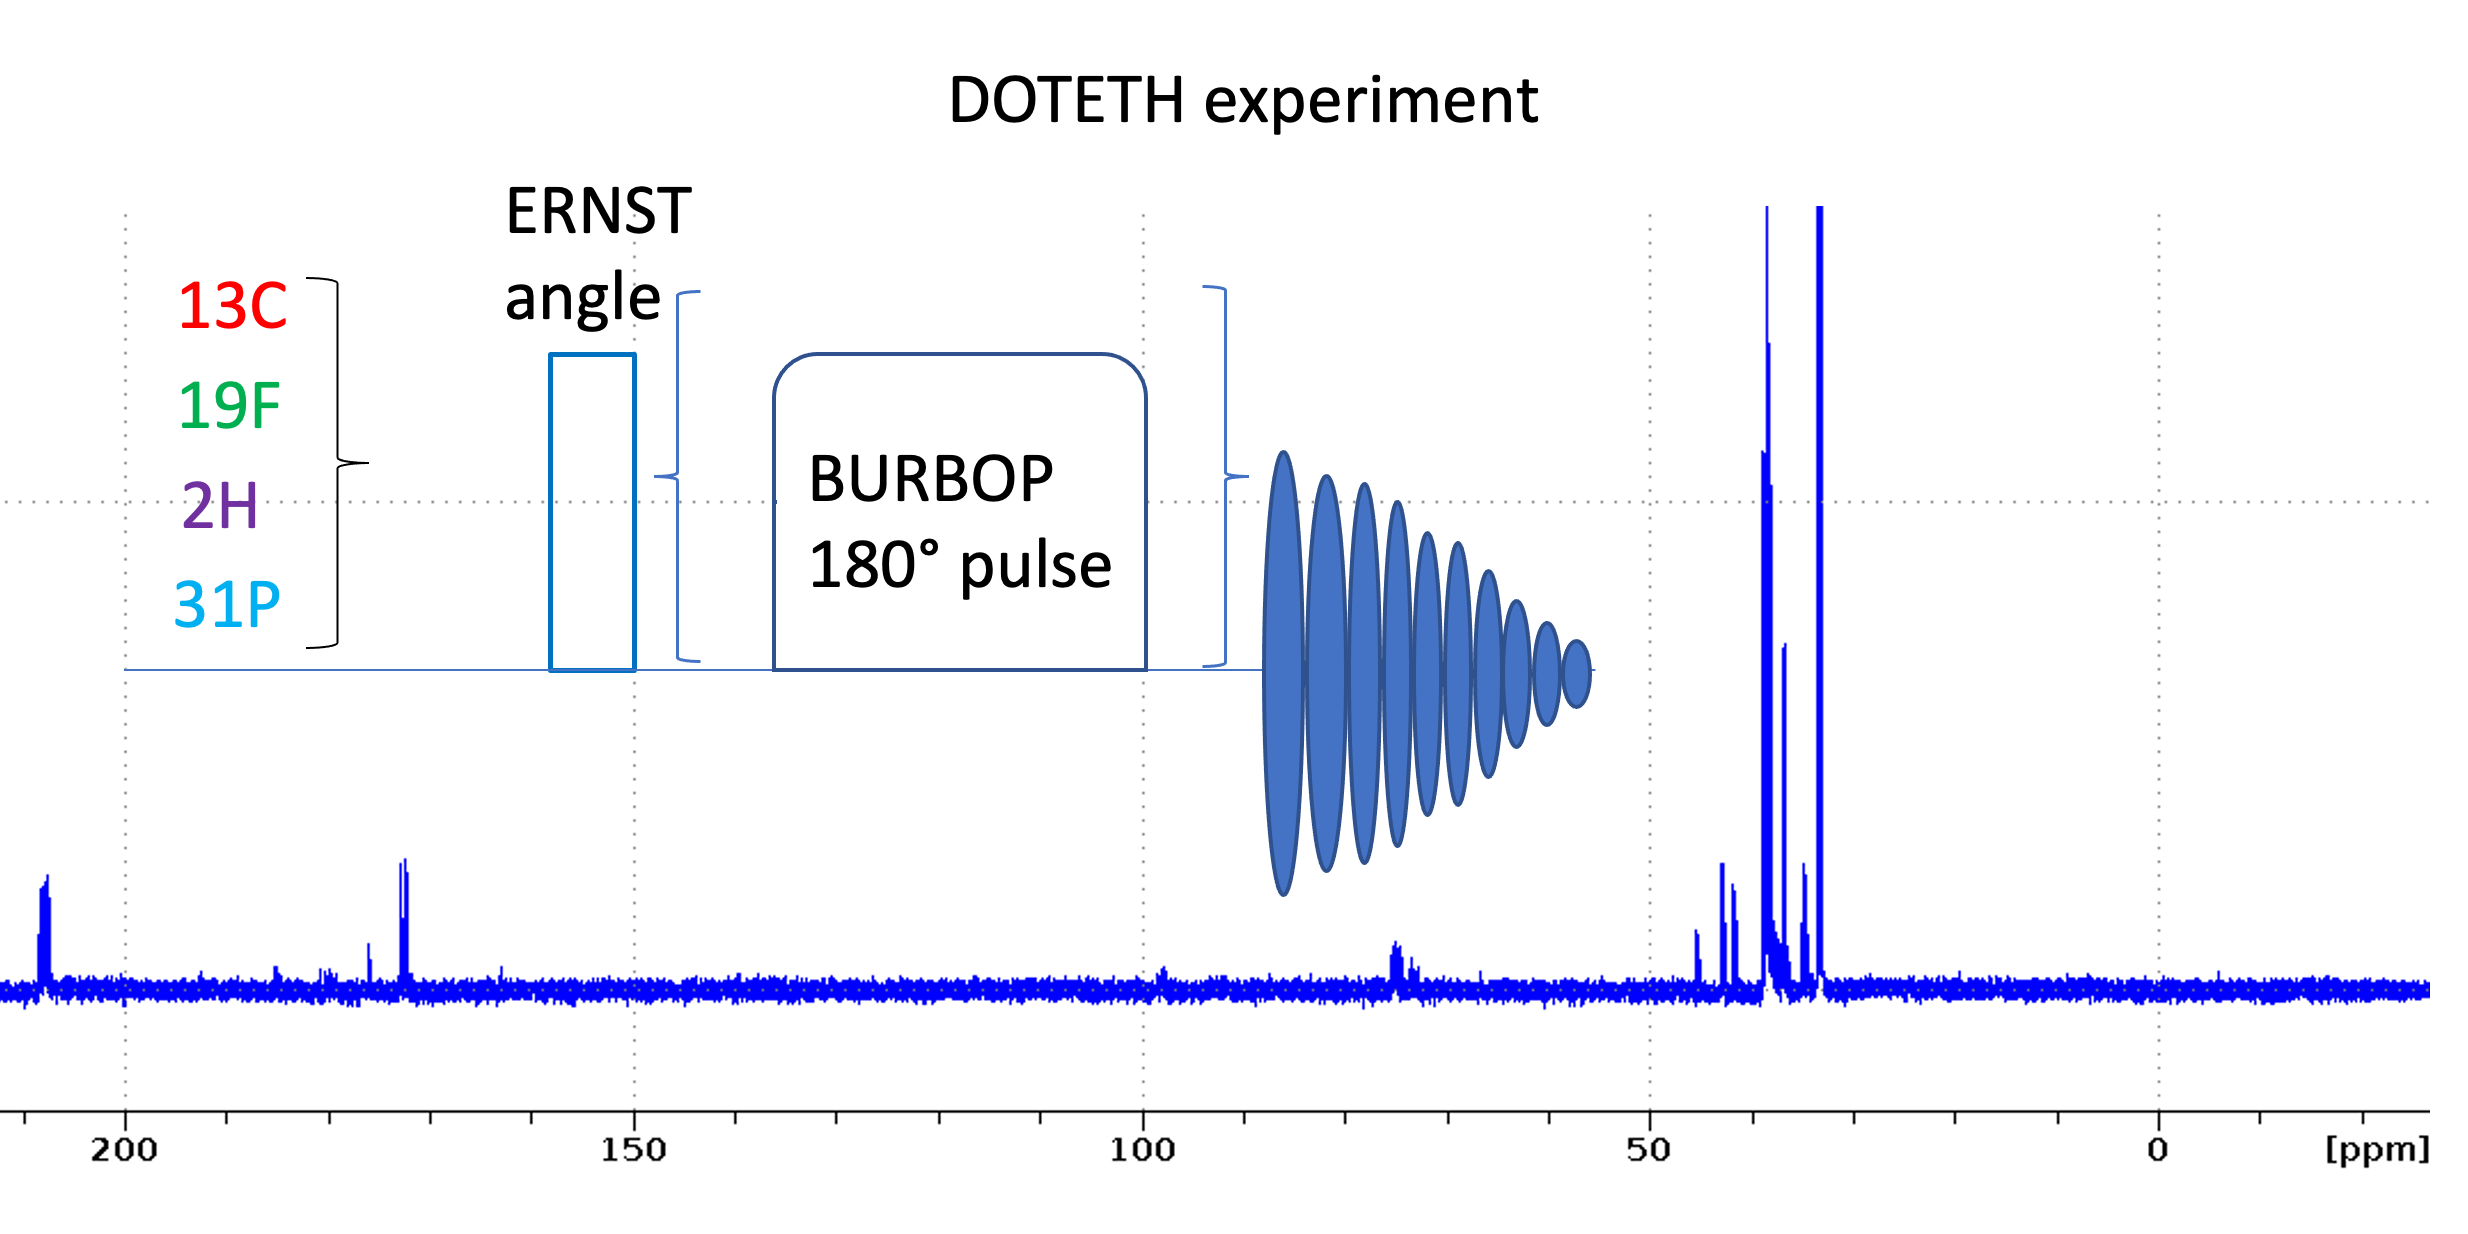
1D heteronuclear detection experiments join the DOTETH library
A new set of 1D experiments for heteronuclear 13C, 2H, 19F, 15N, and 31P detection have been added to our growing DOTETH library.
by Fred Damberger
Our work at the spectrometers includes a new focus on small molecules and screening experiments for interactions. Often it is useful to measure heteronuclear detection experiments. For example, 19F spectra of mixtures of fluorinated compounds contain only a few signals with a low background and very large chemical shift range. 13C spectra also show a wide chemical shift range and are very informative. Sometimes we are interested in assessing the successful isotope labeling of a molecule and a heteronuclear 1D can give a quick answer. 2H spectra can be used to determine the degree of alignment in alignment media, and 31P spectra can be used to follow phosphorylation reactions.
Displaying the new parametersets with RPAR
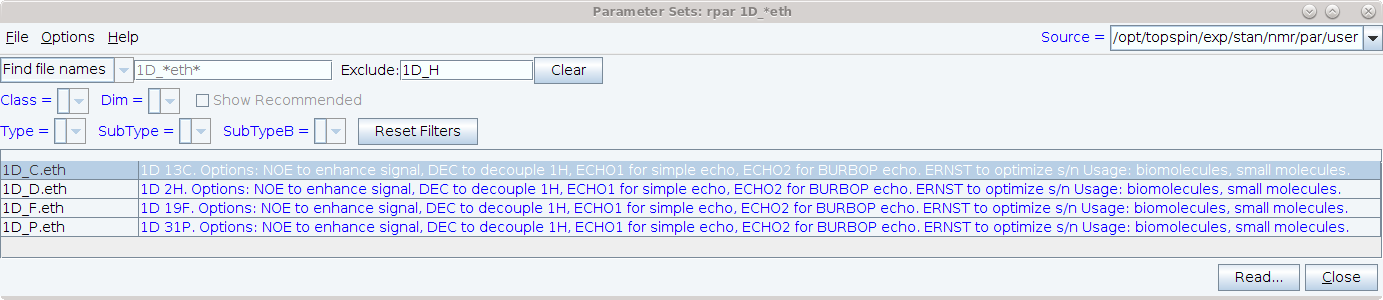
We introduce a set of experiments to quickly set up and measure 1D heteronuclear experiments. Following the DOTETH nomenclature they are named as follows:
13C: 1D_C.eth
2H: 1D_D.eth
19F: 1D_F.eth
31P: 1D_P.eth
15N: 1D_N.eth
You can view the new parameter sets at the spectrometers by entering rpar 1D_*.eth and then entering 1D_H in the rpar window’s exclude field. Don’t forget to turn on options-show comments! Information on these experiments can also be found in the DOTETH documentation pdf which is displayed by entering DOTETH on Topspin’s commandline.
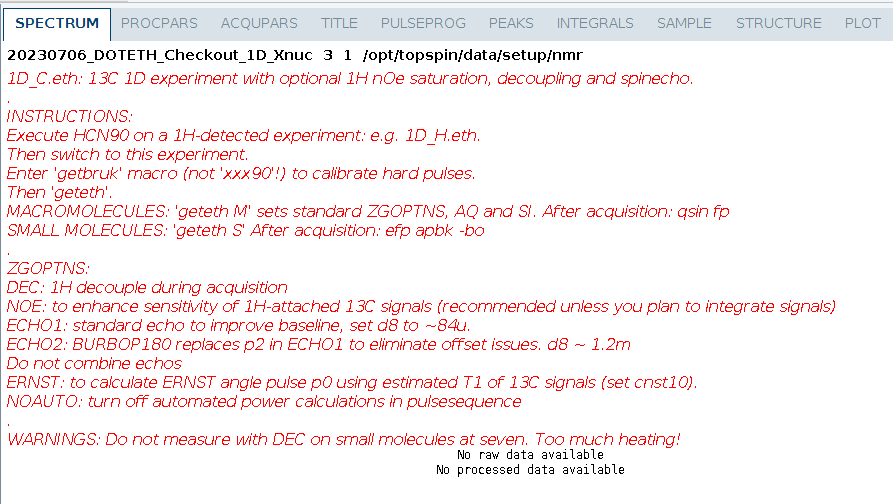
After reading a parameterset, the titletext displays useful options and setup instructions, so you should set the spectrum display options so that the titletext is displayed:
Options
The experiments include a number of useful ZGOPTS:
How to set up the 1D heteronuclear experiments
- Read 1D_H.eth and calibrate pulses using HCN90. This writes the macro getbruk with the getprosol command using the calibrated pulse lengths for 1H, 13C, 15N.
- Read desired heteronuclear 1D parameterset using rpar 1D_*.eth (exclude 1D_H*.eth)
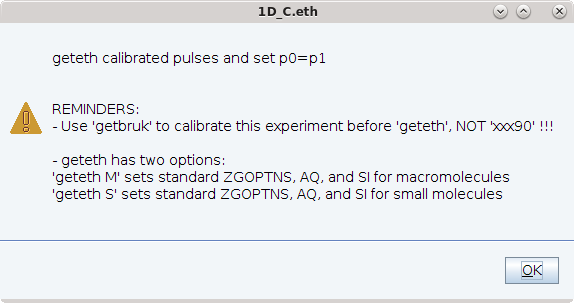
- Enter getbruk to calibrate hard pulses [Note: for 1D heteronuclear experiments you use the getbruk macro. Do not use xxx90 macro to calibrate pulses because p1 is not the 1H pulse!]
- Enter geteth s or geteth m to set up parameters for small molecules or macromolecules (see below)
Command geteth supports optional arguments to setup parameters for either small- or macro-molecules
Small molecules and macromolecules have different T1 and T2 values and the number of signals in 1D spectra differs. The optimal parameters for measuring 1D spectra and processing are therefore also different. To support users in setting up the experiments for these two cases, the doteth command supports two different options:
geteth s sets up the experiment for small molecules.
geteth m sets up the experiment for macromolecules
A number of parameters will be adjusted to give the best results for the selected molecule type and nucleus.
After completing setup, doteth displays an output message which gives the user feedback specifically on which parameters were adjusted as well as some helpful feedback.
You can of course change parameters such as the ZGOPTNS for your particular case. Be especially careful about adjustment of TD or aq if you are using 1H-decoupling. Be aware that the pulsesequences make use of an include file which will abort if excessive heating is expected due to high average power caused by long decoupling and/or short d1.
Here are examples of spectra obtained with each of the new experiments
1D_C.eth
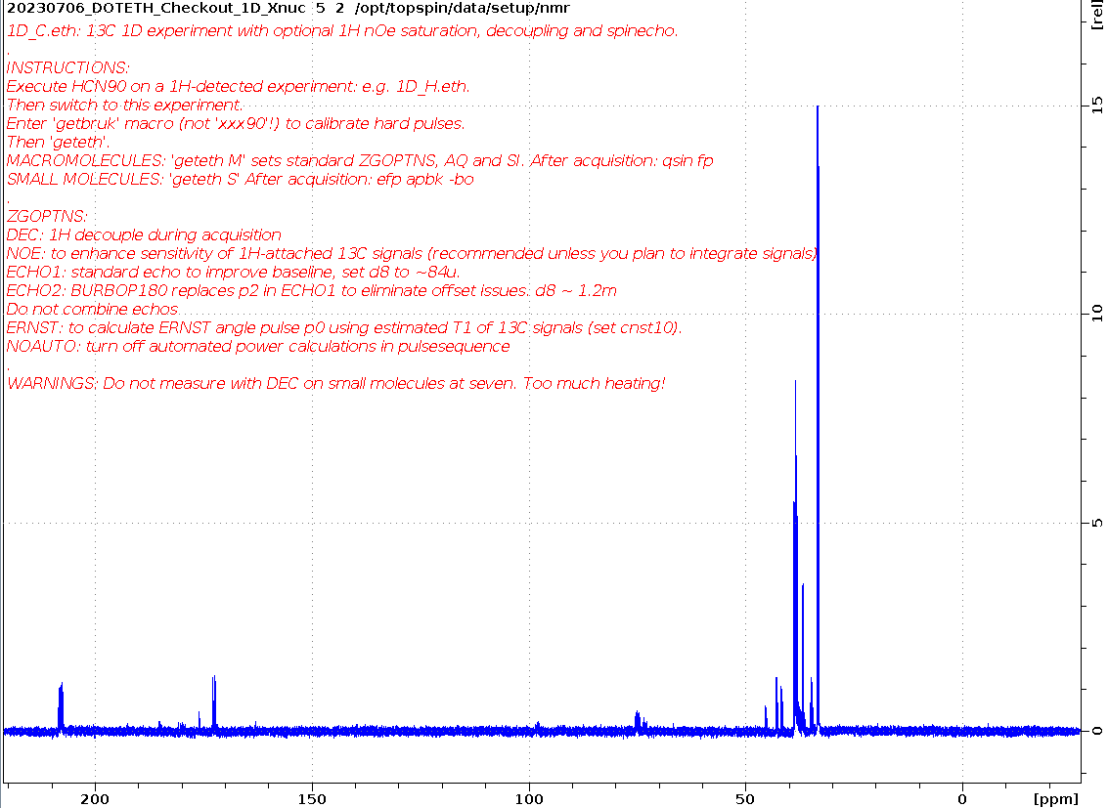
Small molecule measured using ERNST option and apbk processing on five.
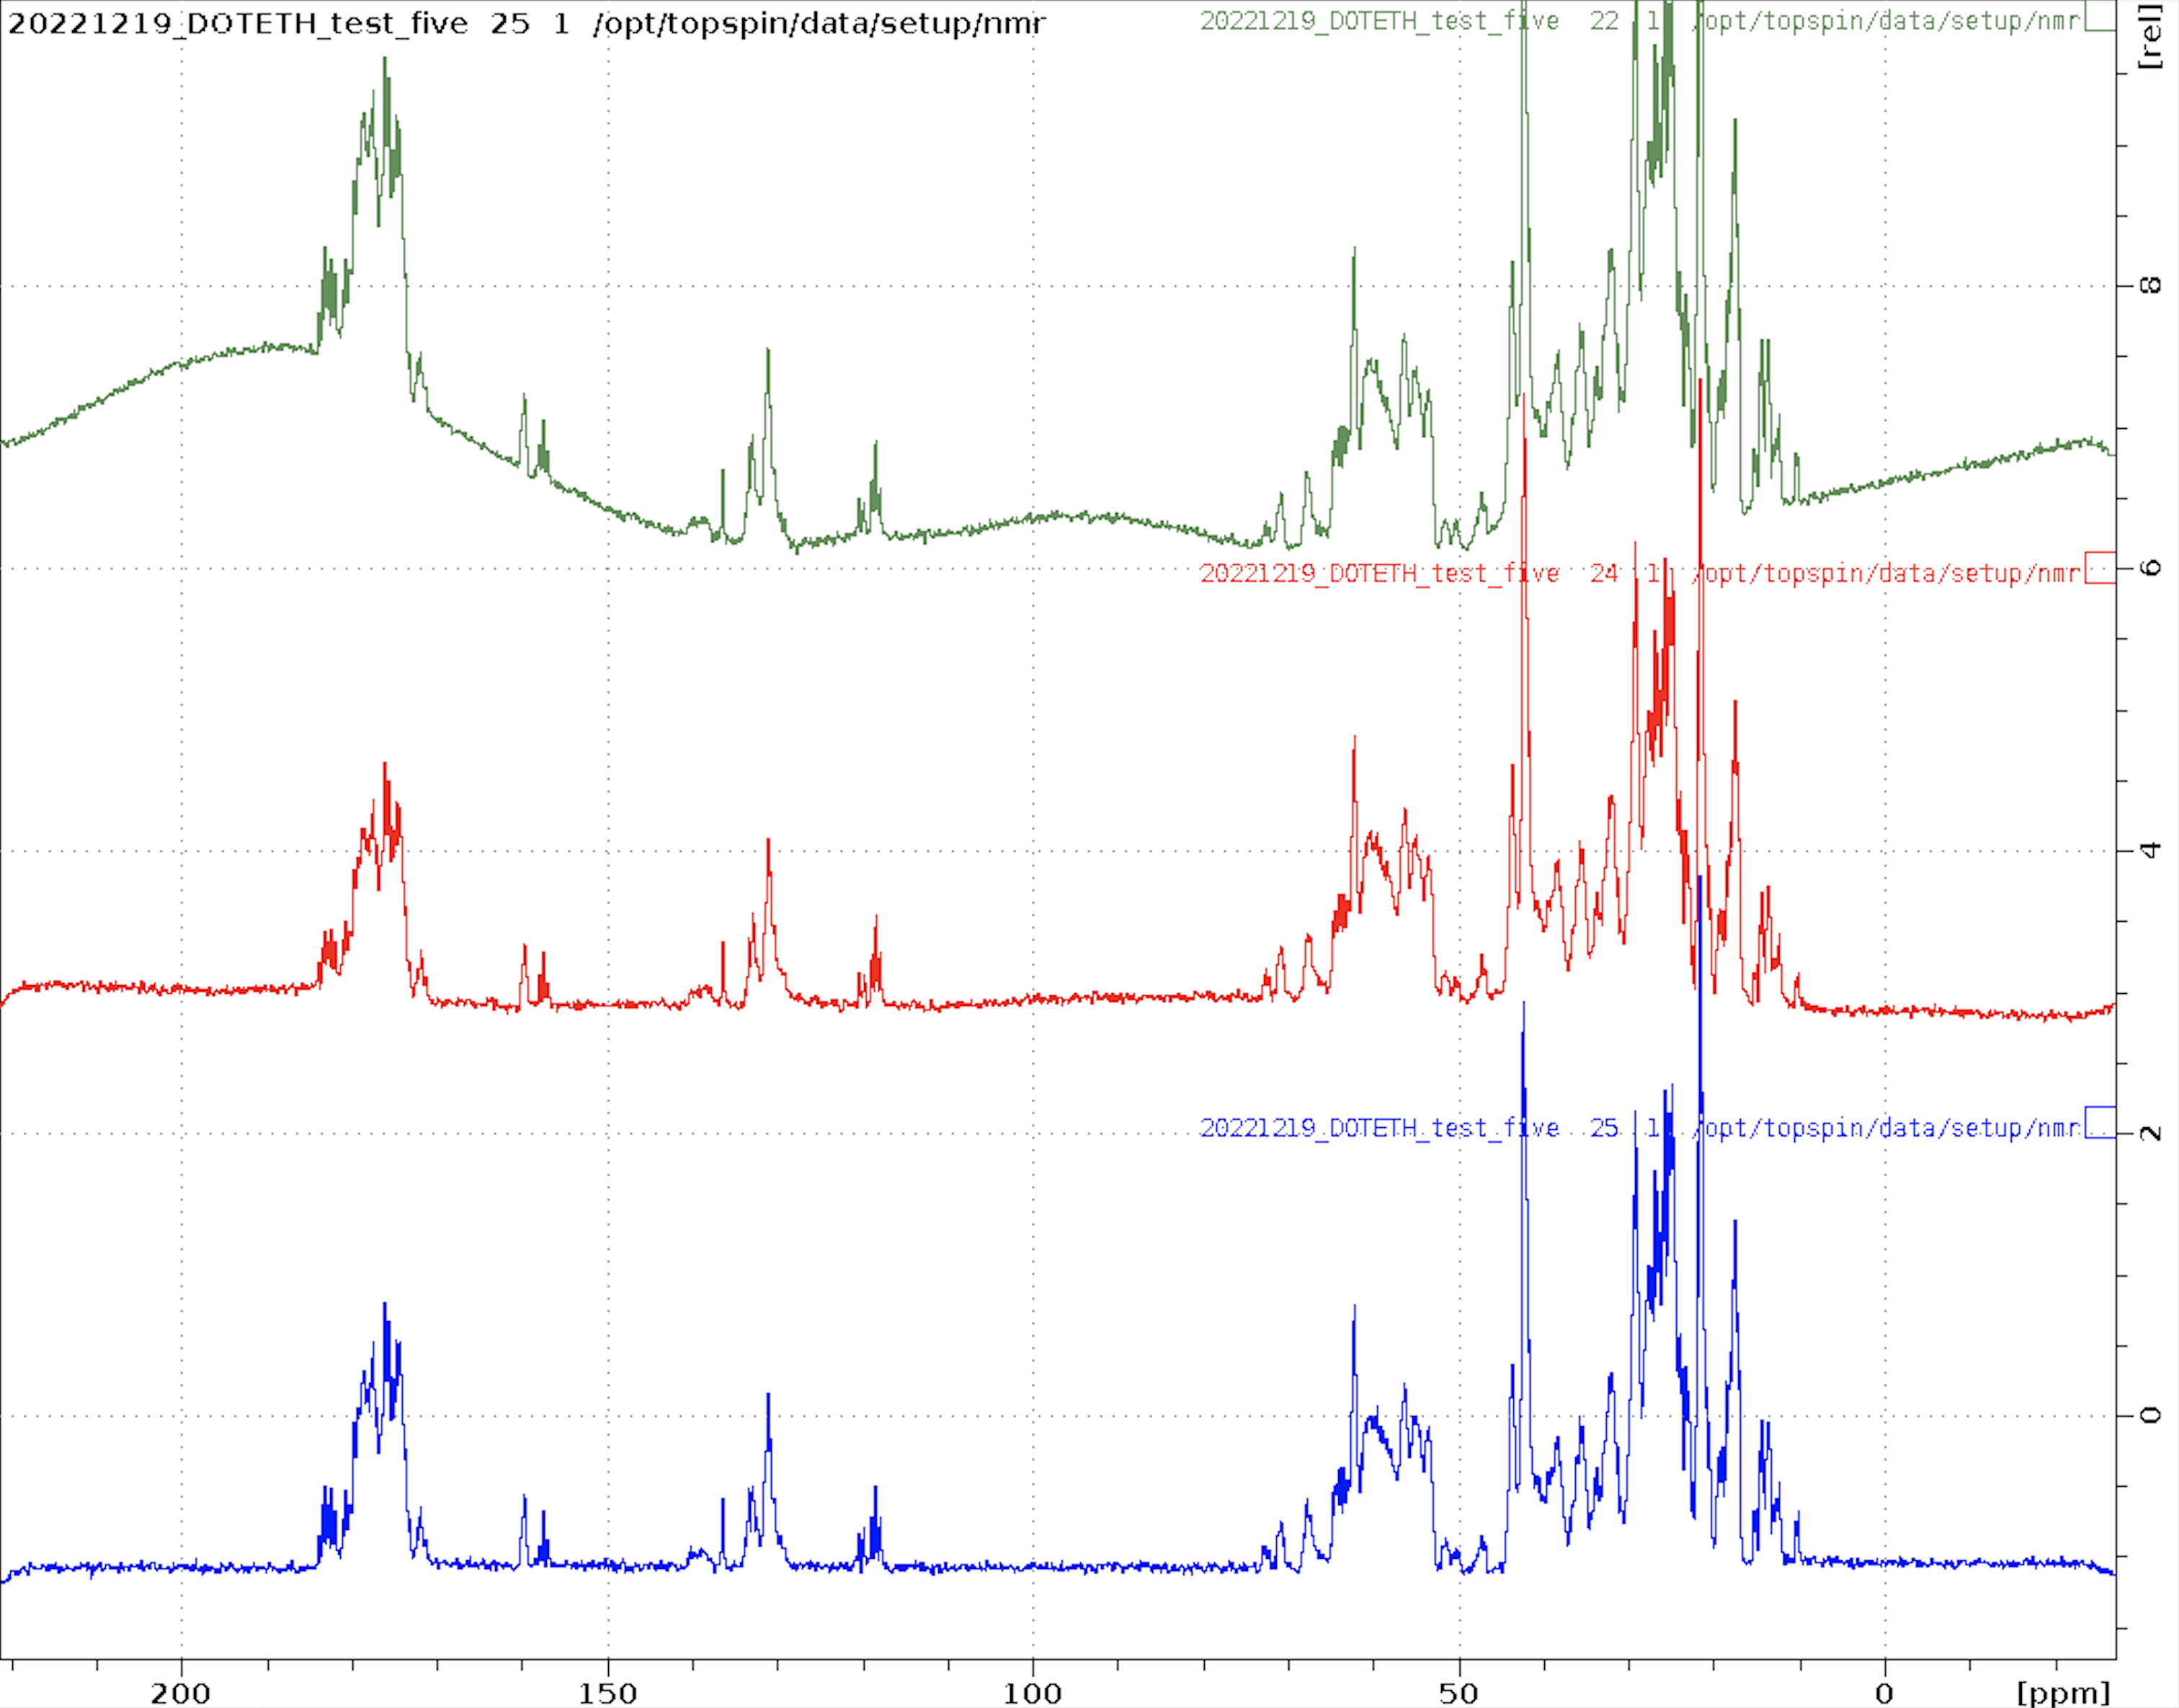
13C,15N-labeled protein measured using no ECHO (green), ECHO1 (red), and ECHO2 (blue) measured on five. Apbk has a hard time correcting the baseline of protein spectra which contain many lines. This is where the spin-echo comes in handy. ECHO2 using the BURBOP 180 gives the flattest baseline.
Adjusting the BURBOP 180deg power to remove baseline distortion
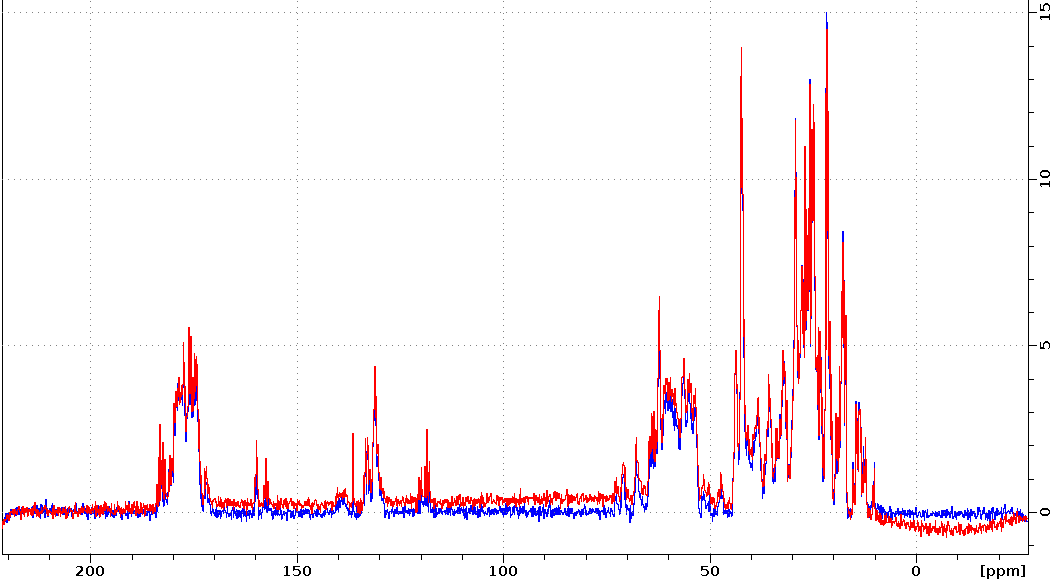
Sometimes ECHO2 will still have slight baseline distortions. In this case slight adjustment of the BURBOP pulses power can improve the baseline. The BURBOP pulse power is calculated by the pulsesequence using p1 (the hard pulse on channel 1). Both spectra were measured with 13C,15N-labeled protein on five. Red was measured with p1=12.3us, the value obtained for the 13C P90 by HCN90. Blue was measured after adjusting p1=12.4us.
1D_D.eth
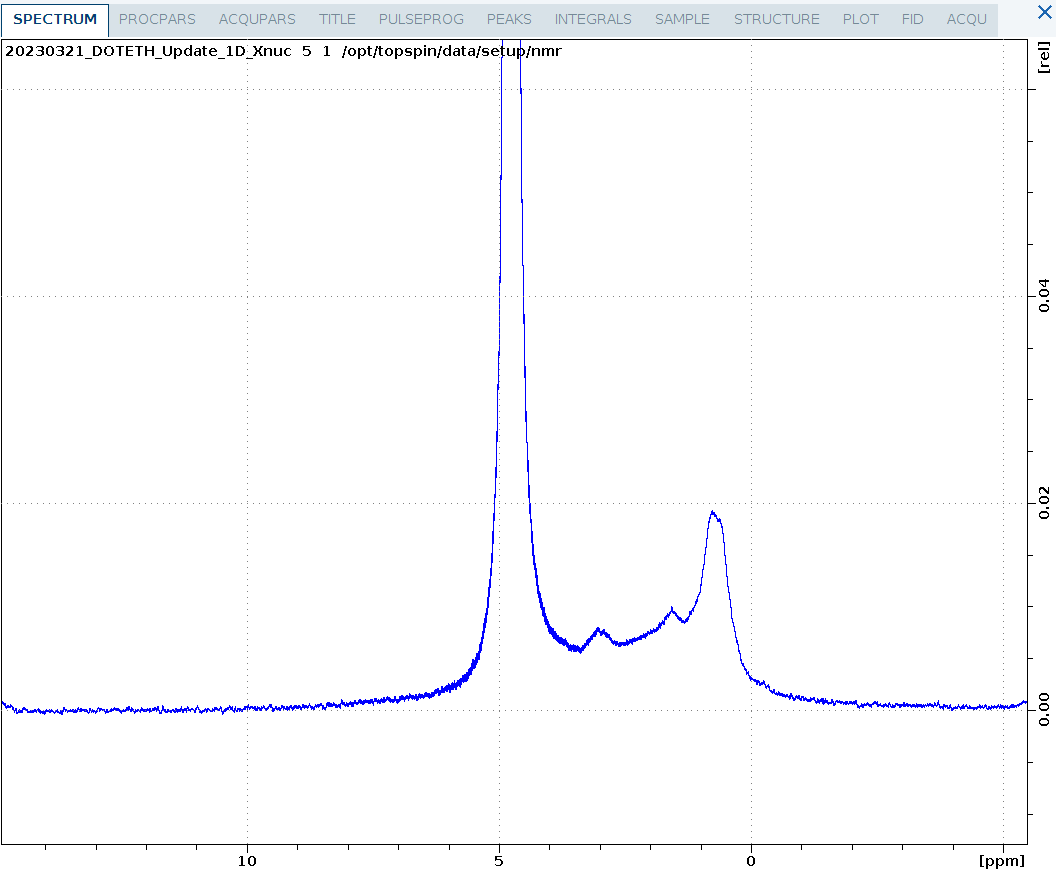
A partially deuterated sample of ubiquitin measured on five. Both the methyl groups and methylene groups are deuterated. Surprisingly, despite solvent signal of 10% D2O, the protein spectrum is clearly visible at 1mM although no solvent suppression is applied. This experiment would also be useful to assess alignment media using the solvent splitting.
Note that the 1D_D.eth experiment automatically turns off the deuterium lock before measurement so the experiment is measured unlocked. After running this experiment, it is necessary to repeat the lock procedure when other experiments should be run locked.
1D_F.eth
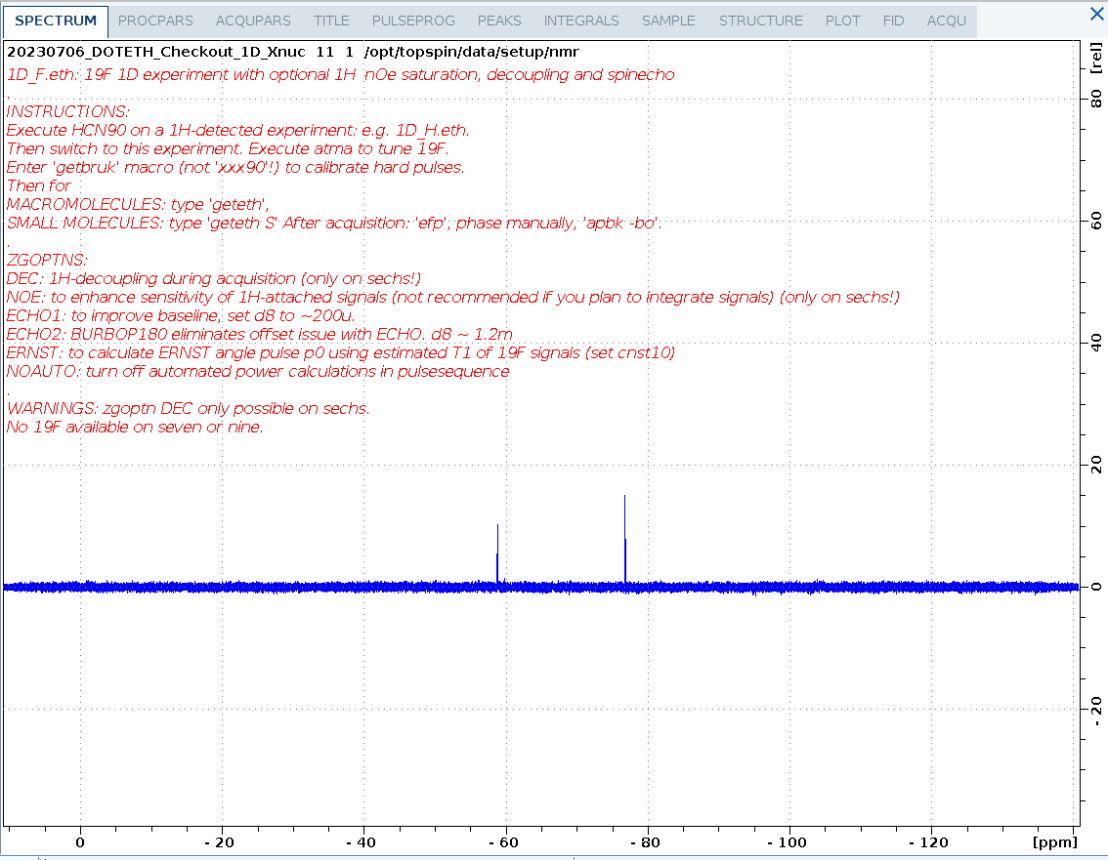
1D 19F spectrum of a small fluorinated molecule.
1D_P.eth
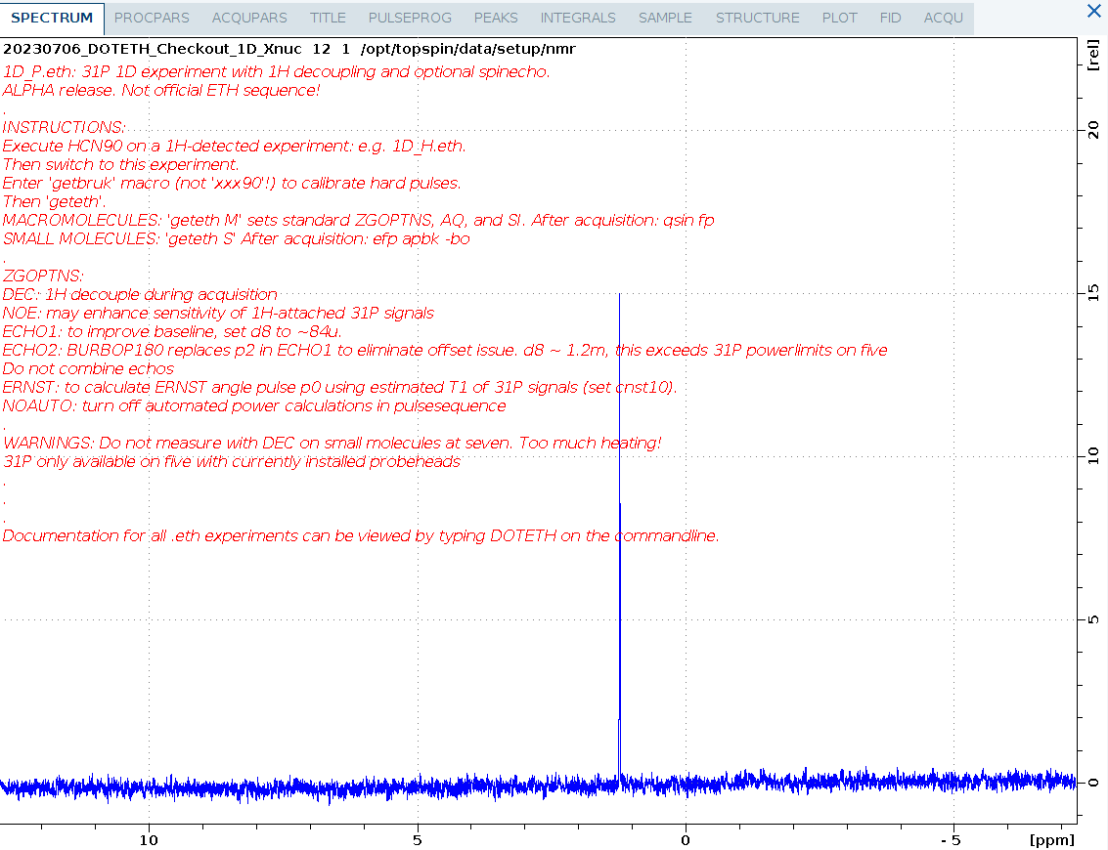
1D 31P spectrum of ATP.
Availability of experiments on spectrometers
Due to the differing probeheads currently installed on our instruments 19F detection is not available on seven and nine, and only sechs allows 1H-decoupling of 19F spectra. 31P detection is currently only available on five.
Table of sensitivity for the currently installed probes:
(updated values can be found here)